
Queue Management

Run every ride at full capacity. Protect the guest experience.

Safari AI uses the cameras you already have to estimate wait times and improve ride throughput.

+10% Throughput 95%+ Queue Wait Time Accuracy
Predicted Wait Times — Thunder Coaster ● LIVE
Right now · 2:35 PM
24
Minute wait
UPDATED 30 SECONDS AGO
Wait time today
10A
11A
12P
1P
2P
3P
4P
5P
ActualNowPredicted
Time to Ride — Guest App ● LIVE
Scanned at entry
13:02
Boards at
13:16
Countdown
Recalculated every dispatch until the guest boards.
Hi Maya
Thunder Coaster
Your wait left
14min
Waited 8 minBoards 2:47
Realized Wait Time — Measured Per Guest ● LIVE
Peak hour
41
MEDIAN 23 MIN ACROSS THE DAY
Minutes actually waited
10A
11A
12P
1P
2P
3P
4P
5P
Median
22m
90th pct
34m
vs Predicted
−3m
Merge Ratio — Express vs Standby ● LIVE
Thunder Coaster Per dispatch · 24 seats
From express
9
guests
From standby
15
guests
37% express63% standby
Express wait
6m
within promise
Standby wait
38m
above threshold
Jump the Queue — Per-Ride Pass ● LIVE
Thunder Coaster Per-ride pass
Standby now
24min
You could wait
6min
Price
$9
per guest
Skip 18 min · $9
Passes issued against merge ratio
Standby wait held flat while 14 passes sold this hour.

↻ Click to cycle through the QMS products


Trusted by operators across North America & Europe
The Problem

Guests don't trust wait times. Operators don't see what's costing them.

  • Rides run under capacity
  • Express lanes are not reliably faster
  • Guests stop believing posted waits
Today
With Safari AI
Throughput
Empty seats, slow dispatches
Improved fill rate & dispatch frequency
Wait Time Estimates
Guests distrust wait times
Accurate waits from live dispatch data
Express Lane Experience
Express lane wait times inconsistent
Consistent & protected express experience

See a demo of the platform.

How it works and what your team sees day to day.

Book a Demo
What We Measure

Vision AI measures three metrics that feed our solution

Dispatch Frequency

How often each cycle actually leaves.

Fill Rate

The share of seats used on every dispatch.

Throughput

Guests per hour, per ride and per shift.

How It Works

Your existing cameras. Live in two weeks.

Day 101
Camera review

Send your camera layout. We confirm which views work and flag gaps.

Week 102
On-prem install

A server goes in on your network. About 30 minutes of IT time.

Weeks 1–203
Calibrate & validate

Every queue is checked against manual counts before going live.

Live04
Go live

Waits, throughput and merge data reach your app and signage over the API.

Walk through every product with our team.

See how it would work at your park, plus a free trial.

Book a Demo
The Solution

Wait times and express lanes your team and your guests can reliably trust.
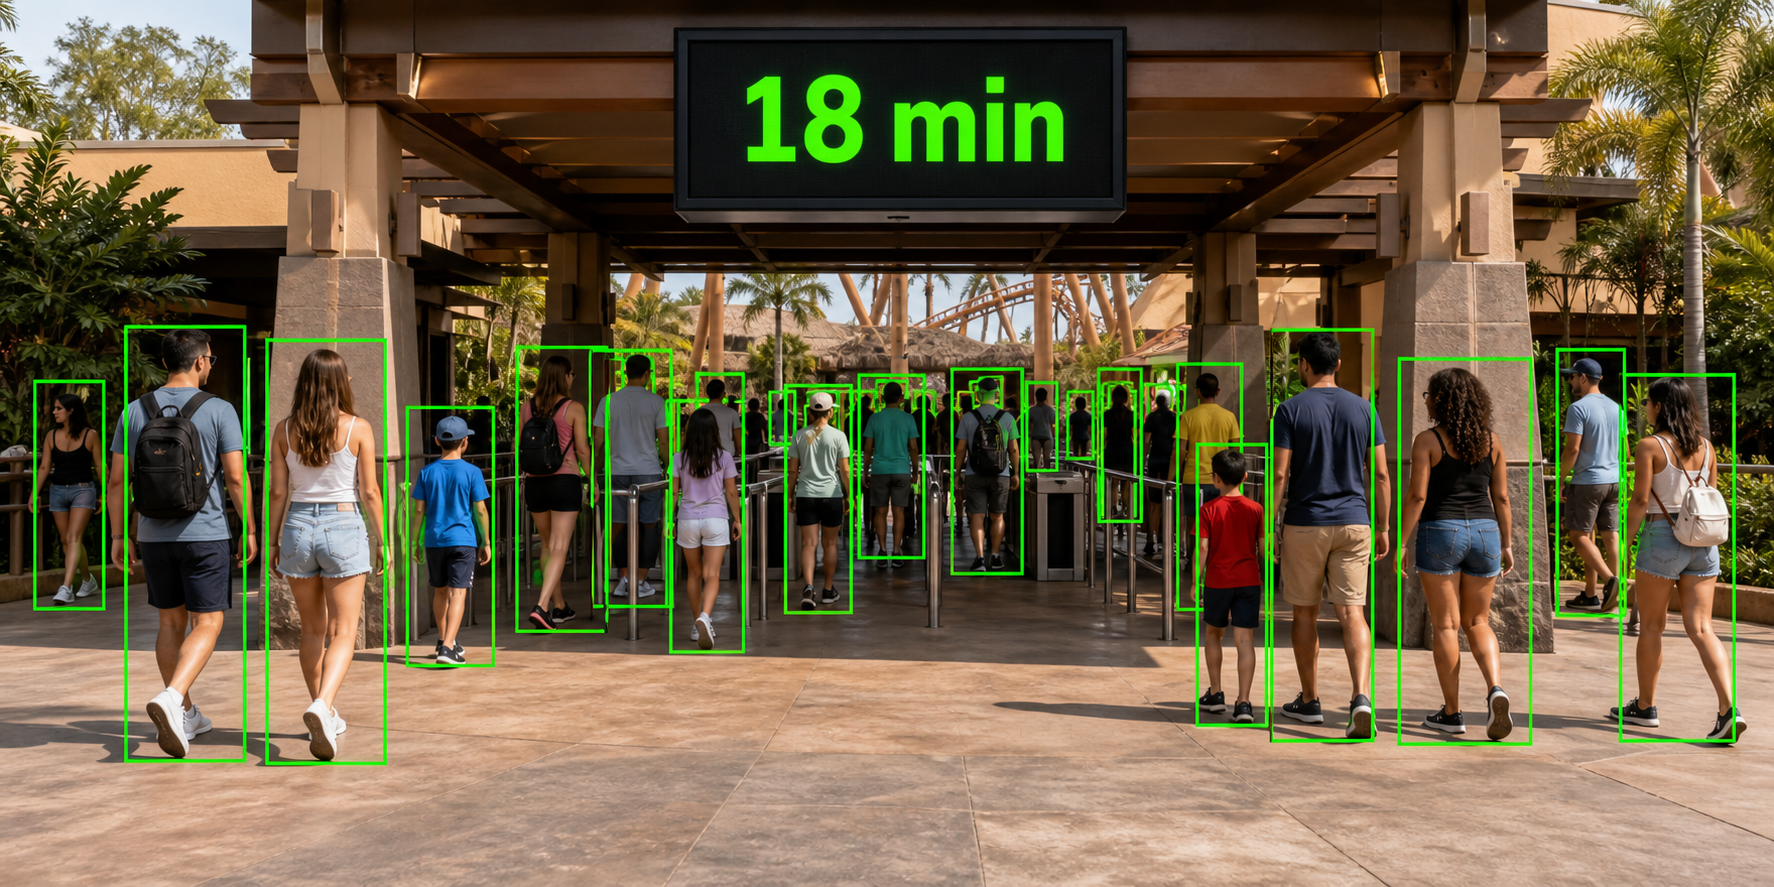
Guests entering a queue under a sign showing an 18 minute wait
Predicted Wait Times
What it does

Post accurate wait times for every ride

Why it matters
  • A reason to open the app — accurate waits make the app the tool guests check all day, which is where you sell passes, food and merchandise
  • Demand spreads across the park — guests move to shorter lines instead of queuing at one ride
  • Trust compounds — once guests find the posted wait accurate, they are far more willing to pay to skip a line
Queue-entry board
Thunder Coaster
Right now · 2:35 PM
24
Minute Wait
UPDATED 30 SECONDS AGO
Wait time todayActualNowPredicted
10A
11A
12P
1P
2P
3P
4P
5P
6P
7P
8P
Jump the Queue
What it does

Skip the line for a single ride, buy it in the guest app.

Why it matters
  • A new set of buyers — guests who wouldn't spend on a full-day express pass will pay to skip one high demand ride
  • Premium on your busiest rides — high-demand attractions become their own paid experience
  • Without taxing standby — passes are issued and coordinated with the merge ratio to keep standby and express lines in balance.
Jump the Queue
Thunder Coaster Per-ride pass
Standby now
24min
You could wait
6min
Price
$9
per guest
Skip 18 min · $9
Time to Ride
In the guest app
QR code at queue entry
Scan at
queue entry
Hi Maya
Thunder Coaster
Your wait left
14min
Waited 8 minBoards 2:47 PM
What it does

Scan a QR code at queue entry to get a countdown to boarding time.

Why it matters
  • Guests adopt the app — a reason to download it and keep it open through the day
  • An upsell moment — upsell a jump the queue pass or a mobile food order on your app while they wait in queue
  • Trust in your numbers — give guests a boarding time ETD so they believe the wait time for the next ride
Merge Ratio
Merge ratio, live
Thunder Coaster Per dispatch · 24 seats
From express
9
guests
From standby
15
guests
37% express63% standby
What it does

Control the express-to-standby split for every dispatch.

Why it matters
  • Express keeps its value — the paid lane delivers the wait guests bought
  • Standby is not taxed for it — keep the express lane waits shorter without letting standby waits go out of control
Realized Wait Time
What it does

Keep a record of the exact time every guest waited in queue.

Why it matters
  • Understand performance — accurate waits show which attractions and crews are underperforming
  • Update your operations — operations teams make decisions based on accurate measurements rather than estimates
  • Faster throughput, more spend — every minute freed from queueing is a minute a guest has for food, retail or another attraction
Realized wait, hour by hour
Thunder Coaster
41
MEDIAN 23 MIN ACROSS THE DAY
Minutes actually waited
10A
11A
12P
1P
2P
3P
4P
5P
6P
7P
8P
FAQ

Questions we hear from operations teams

How do you measure queue length?

Cameras count the number of guests in the queue and measure the throughput of the ride, then combine the two to estimate how long it will take the next guest to get onto the ride.

Do we need to install new cameras?

For a proof of concept, usually not. At scale, many clients add cameras to get the best views of their operations.

Where do guests see the wait times?

Your guest app, queue-entry boards and park signage. Times are available over an API, so they flow into the channels guests use today.

How long does deployment take?

A proof of concept takes about two weeks and roughly 30 minutes of your IT team's time. Our engineers configure each queue and load platform on your behalf and validate the numbers with your ops team.

What does our IT team have to do?

Read-only RTSP access to the relevant camera streams and a contact for the network review. Video is processed on an edge device and is not retained; only metadata is sent to the cloud, available to you via REST API.

Get Started

Run your queues on real data.

Book a 30 minute demo, or send a note and we'll be in touch within one business day.

  • A live walkthrough of features
  • How it could work for your operation
Prefer to skip the form?
Book a Demo directly