
The Halftime Window: What Blind Arena Operations Actually Costs
INDUSTRY INSIGHT • 2026
How the first season sets patterns that persist for years, and why the venues getting it right are building the intelligence layer in, not bolting it on after.
A billion-dollar arena is opening this fall. On opening night, its operations team will be flying blind.
The gates open at 5:30. By 6:15, Entry C is backing up into the parking structure, but nobody on the operations team knows yet. They are managing three radio channels and watching a wall of static camera feeds. By the time a security guard calls it in at 6:40, twenty-five minutes of compounding friction have already passed and the guest experience has already been written. The cameras were there the entire time. The intelligence layer was not.
That is the default condition for nearly every new arena that opens without real-time crowd visibility, regardless of the building's price tag or the quality of the team running it. The cameras are installed, the security systems are live, and the ticketing platform is running. What is missing is the layer that turns all of it into operational awareness in the moment decisions actually need to be made.
For a $1.5 billion building running 40 to 80 revenue events per year, that gap compounds quickly. Every event is a four-to-five hour window, and what happens in year one sets the pattern. Staffing models calcify around the friction instead of solving it, and F&B deployment follows historical averages that were wrong from the start and stay wrong for as long as no one has the data to correct them. The north star for stadium operations has always been simple: return fans to their seats as quickly as possible. A fan waiting 12 minutes in a concession line is a fan who misses the third quarter, leaves early, and thinks twice about the premium experience next time. At $25 to $40 per fan in F&B and retail, the difference between a well-run halftime and a reactive one is not an operational footnote. It shows up on the P&L.
What Flying Blind Looks Like in Real Time
Here is how the same opening night event unfolds, without intelligence, and with it.
The Halftime Problem
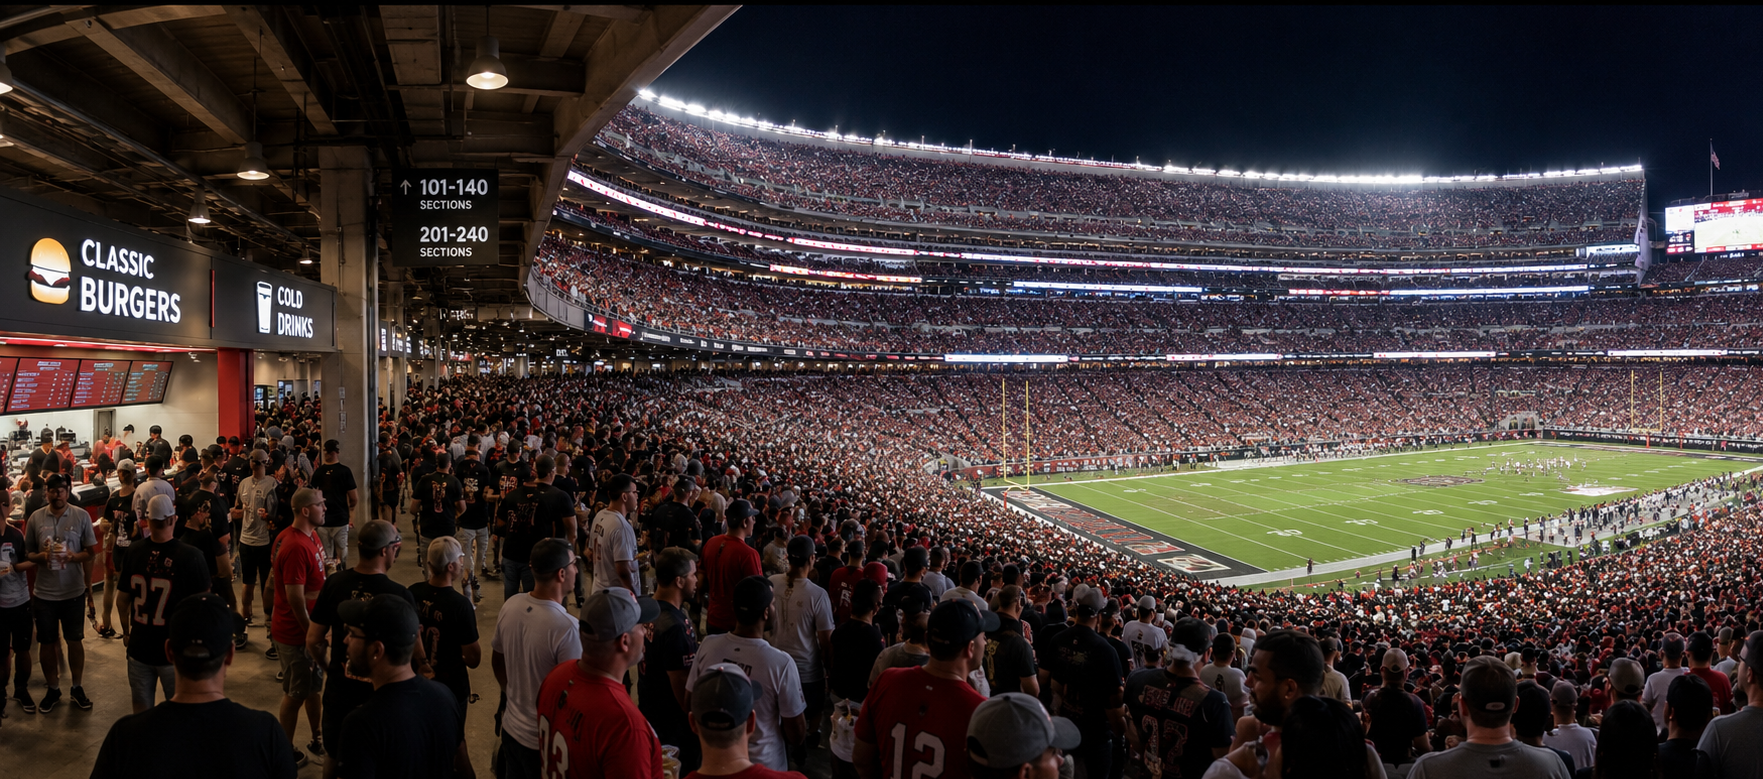
F&B at halftime is the clearest example of what blind operations costs. A five-minute window. 20,000 fans moving simultaneously. Whether that window yields anywhere near its potential depends entirely on whether the right staff and inventory are in the right zones before the buzzer sounds.
Concourse design can distribute flow. Better signage can nudge it. But only real-time intelligence tells an ops leader which corridor is approaching saturation, which stand will hit a 12-minute queue in the next eight minutes, and where underutilized capacity exists right now, while there is still time to act.
"I Don't Know What We Left on the Table"
A senior revenue executive at a major university athletic program described what his first big concert season taught him. His team had made a major investment in their F&B operation, dramatically expanding the number of POS systems across the venue, and concession revenue roughly quadrupled as a result.
But when asked how much revenue the long lines had cost them anyway, his answer was unambiguous:
"I don't know what we left on the table this year because of big lines. It's a substantial business loss."
That's an honest answer. It's also the default condition at nearly every venue running without real-time crowd intelligence. The operation improves, revenue goes up, and the gap between what happened and what was possible stays invisible.
When an NBA franchise's retail director used foot traffic data to prove a congestion problem, not a merchandising problem, leadership approved a CapEx pitch for retail expansion. That case only existed because the data existed.
What Opening With Intelligence Looks Like
Safari AI deploys vision models on the camera infrastructure already specified in arena construction. No additional hardware, no retrofit after two seasons. Real-time crowd intelligence from opening night, across every zone that matters.
The first season builds the dataset. Every season after gets more efficient.
Where Real-Time Intelligence Changes the Operation
Safari AI's vision models run on existing camera infrastructure to surface continuous, zone-level intelligence across the full venue. Here is what that unlocks across four operational areas.
- Track density at every gate and entry lane in real time, with threshold-based alerts before queues back up
- Identify which entry points are concentrating demand and redirect flow before saturation
- Alert floor managers in time to open additional lanes or reposition staff while the window is still open
- Build entry-point benchmarks by event type and attendance to pre-position staff for future events
- Monitor concourse density in the final minutes of each period to predict which zones will surge at the break
- Identify which stands are tracking toward 10+ minute queues before the rush arrives, while there's still time to reposition staff
- Surface underutilized F&B capacity in adjacent zones and signal floor managers to redirect traffic
- Build per-stand, per-event benchmarks to inform staffing decisions before each subsequent event
- Track foot traffic, dwell time, and congestion in retail zones continuously across every event
- Identify which locations have congestion problems vs. merchandising problems, the distinction matters for how you solve it
- Generate the data foundation for CapEx decisions on retail expansion, repositioning, or reconfiguration
- Build event-type benchmarks showing how retail flow differs between games, concerts, and private events
- Monitor egress corridor density in real time as crowds begin to move post-event
- Alert operations teams when specific corridors approach saturation thresholds before clearance rates become a safety risk
- Identify which exit points are concentrating and signal floor managers to open alternates or redirect signage
- Build egress benchmarks by event type and attendance to inform pre-event corridor staffing decisions
The Opportunity
The venue already has the infrastructure.
It already has the cameras.
It already has the revenue potential.
The missing layer is real-time operational intelligence.
Every event in year one is setting a pattern, in staffing models, in F&B deployment, in how fans learn to move through the building. Those patterns will persist for years. The venues that open with real-time intelligence aren't just running their first season better. They're building the foundation that makes every subsequent season sharper.
The command center on the concourse, running on live data, isn't a future-state vision. It's already operational at the venues that understood early what the data was worth.
The Intelligence Is Already in Your Infrastructure
Every camera already specified in your arena build is a potential real-time data source. Safari AI turns that existing infrastructure into a 24/7 operational intelligence engine, no new hardware, no retrofit after two seasons, no guesswork.
Join the venues, franchises, and operators already using Vision AI to run smarter, more responsive events from opening night.
Citations
1 F&B conversion rate benchmark of 25–35% derived from venue operations research published by Populous and referenced across Sports Business Journal coverage of concession analytics. 30% represents the conservative midpoint of the commonly cited range.
2 Average F&B transaction value of $18 derived from per-cap spending figures reported across franchise financial disclosures and the National Sports Forum. Reported per-cap ranges of $15–$25 per fan per event; $18 represents a conservative midpoint for a mid-tier arena event.